A Hockey Analytics Post...
A step-by-step intro to querying the NHL's API, extracting and visualizing interesting data
Introduction
This post presents a visualization of the shooting pattern of each team for the seasons 2016, 2017, 2018, 2019 and 2020
compared to the league average. We then walkthrough a simple guide for querying the NHL’s API, which serves as a first step
towards visualizations such as the one below. Finally, we provide a few other static visualizations of the relationships
between goals, shot types and shot distance.
Warning, the interactive visualization below takes a little while to load (~45 seconds),
hang in there! If your browser warns that the page has become unresponsive, click wait. I swear it’s worth it ![]()
Visualization
Lets start with the main show before jumping into the walkthrough to get there.
To use the visualization, please select a team first and then the season. The visualization currently crashes
if the year is selected first.
From the figure above, we see where are the differences between a team’s shooting pattern vs the year average for the league. A red zone represent a spot in the offensive zone where a team tend to shoot more than the league average whereas a blue zone represent a zone where a team tends to shoot less from than the league average on that year. To get the actual number of shots per hour in excess of the league from a zone, you need to multiply the area of an elipsoid by its color value. Therefore, as a zone color gets deeper and the widder is the area it covers, the more the difference with the league average increase.
A Simple Guide to Querying the NHL’s API
We will build a complete hockey data loader object! Here’s an overview of our final class and functions signatures before we jump in (for brevity’s sake, some boiler-plate parameters are omitted):
| -- assert_year(year) -> None # Static func
|
| -- HockeyDataLoader() # Main Class
|       |
|       |--- get_game_data(game_id: str, year: str) -> None
|       |--- get_regular_season_data(year: str) -> None
|       |--- get_playoffs_data(year: str) -> None
|       |--- get_season_data(year: str) -> None
|       |--- acquire_all_data() -> None
Now lets walk through our functions - we will approach them in a bottom-up approach - from getting a single game-data, to a season’s data; and finally all the data we may need! Let’s begin with our first simple static function: This function serves to assert that the year for which we will request the data is valid and correctly formatted.
def assert_year(year) -> None:
    """
    Simple function to assert a season year is valid.
    Extracted as a method to reduce clutter.
    :param year: Season year as a 4-letter string (ex: '2016').
    :return: None
    """
    assert (len(year) == 4)
    assert (2016 <= int(year) <= 2020)
Let’s define our HockeyDataLoader object! We provide the following definition and constructor function.
Upon initialization, we set the season years of interest (ex: ‘2016’ for the ‘2016-2017’ season) and the path where the resulting JSONs will be the saved as attributes.
Finally, if the provided path is not a directory, one is created.
RAW_DATA_PATH = './your-local-data-dir/'

class HockeyDataLoader:
    """
    Class handling all seasonal data loadings.
    """

    def __init__(self, season_years=None, base_save_path=RAW_DATA_PATH):
        if season_years is None:
            season_years = ['2016', '2017', '2018', '2019', '2020']
        self.SEASONS = season_years
        self.base_save_path = base_save_path

        if not os.path.isdir(self.base_save_path):
            os.mkdir(self.base_save_path)
Now let’s jump-in the core of the process - our dataloader functions!
- The following function accepts a year and a game_id (more on how we get those in a minute!),
asserts the validity of the provided year, verifies if a JSON file already exists with that game id name in the data directory,
and finally saves the response of a request made to the NHL API in a JSON file in the determined data directory if the file was not already there.
If the files already exists, the functions returns before requesting the API.
def get_game_data(self, game_id: str, year: str, make_asserts: bool = True) -> None: """ Get a single game data and save it to base_save_path/game_id.json :param game_id: id of the game. See https://gitlab.com/dword4/nhlapi/-/blob/master/stats-api.md#game-ids :param year: 4-digit desired season year. For example, '2017' for the 2017-2018 season. :param make_asserts: boolean to determine whether or not make sanity checks. False if function is called from get_season_data :return: None """ if make_asserts: assert_year(year) # Check if file exists already file_path = os.path.join(self.base_save_path, f'{game_id}.json') if os.path.isfile(file_path): return # Request API response = requests.get(f"https://statsapi.web.nhl.com/api/v1/game/{game_id}/feed/live/") # Write to file with open(file_path, 'w') as f: f.write(response.text) - The following function receives a year and requests all the regular season game of that season.
First, we assert if that year is a valid identifier. Then, we choose the correct number of game in the season depending on the year (due to normal and not so normal events, such as new teams
joining the league or global pandemics, this number varies). Finally, we generate a list of game_ids and call
get_game_data(...)on each game_id in the following fashion: - For every game number, 0-pad the game number to obtain a 4 digit number (1 -> 0001)
- Concatenate this number with a string of the form “year02”, where 02 is the indicator of a regular season game (i.e. not a playoff game). We finally obtain a game_id of the form “2016020001” for the first game of the regular season of 2016 for example.
- Call get_game_data(…), providing the game_id and year as parameters.
def get_regular_season_data(self, year: str, make_asserts: bool = True) -> None: """ Function using REST calls to fetch data of a regular season of a given year. Saves resulting json in the path defined in self.base_save_path :param year: 4-digit desired season year. For example, '2017' for the 2017-2018 season. :param make_asserts: boolean to determine whether or not make sanity checks. False if function is called from get_season_data :return: None """ if make_asserts: assert_year(year) # Regular Season game-ids if year == '2016': no_of_games = 1231 # 1230 matches in 2016, a new team was introduced after elif year == '2020': no_of_games = 869 # 868 matches in 2020 because of covid else: no_of_games = 1272 game_numbers = ["%04d" % x for x in range(1, no_of_games)] # 0001, 0002, .... 1271 regular_season = [f'{year}02{game_number}' for game_number in game_numbers] # Get game data for game_id in tqdm(regular_season,total=len(regular_season), desc=f"Regular {year}-{int(year)+1} Season Matches"): self.get_game_data(game_id, year, self.base_save_path, make_asserts=False) - The following function serves a similar purpose as
get_regular_season_data(...)but for playoff matches. We start by asserting the year is a valid identifier. Then we obtain all the game_ids and call get_game_data() on each of the combinations in the following manner: - The prefix (first 8-digit) of game-id is the concatenation of the year, “03” (playoff match indicator), “0X” where X is “1” for the eights of final, “2” for the quarter-finals, “3” for the semi-final and “4” for the final.
- We then concatenate the matchups: there are 8 matchups for the eights of final, 4 for the quarter finals, 2 for the semi-final, and 1 for the final.
- We then concatenate the match number: for any matchup, there can be up to 7 matches.
    def get_playoffs_data(self, year: str, make_asserts: bool = True) -> None:
        """
        Function using REST calls to fetch data of the playoffs of a given year. Saves resulting json in
        the path defined in self.base_save_path
        :param year: 4-digit desired season year. For example, '2017' for the 2017-2018 season.
        :param make_asserts: boolean to determine whether or not make sanity checks. False if function is called from
        get_season_data
        :return: None
        """
        if make_asserts:
            assert_year(year)

        # Playoffs game-ids.
        # eights of final
        playoffs = [f"{year}0301{matchup}{game_number}" for matchup in range(1, 9) for game_number in range(1, 8)]
        # quarter final
        playoffs.extend([f"{year}0302{matchup}{game_number}" for matchup in range(1, 5) for game_number in range(1, 8)])
        # half finals
        playoffs.extend([f"{year}0303{matchup}{game_number}" for matchup in range(1, 3) for game_number in range(1, 8)])
        # final
        playoffs.extend([f"{year}0304{1}{game_number}" for game_number in range(1, 8)])

        # Get game data
        for game_id in tqdm(playoffs, total=len(playoffs), desc=f"Playoff {year}-{int(year)+1} Season Matches"):
            self.get_game_data(game_id, year, self.base_save_path, make_asserts=False)
- The following function is simply a wrapper around our previous two functions! Given a year which it asserts is a valid identifier
it calls both
get_regular_season_data(year)andget_playoffs_data(year).def get_season_data(self, year: str) -> None: """ Function using REST calls to fetch data of a whole season (regular season & playoffs). Saves resulting json in the path defined in self.base_save_path :param year: 4-digit desired season year. For example, '2017' for the 2017-2018 season. :return: None """ # Sanity checks assert_year(year) # Get game data self.get_regular_season_data(year) self.get_playoffs_data(year) - The following function is our final wrapper! It calls
get_season_data(year)for each year in the seasons we have initialized ourHockeyDataLoaderdef acquire_all_data(self): """ Fetches data for all seasons contained in self.SEASONS :return: None """ for year in self.SEASONS: self.get_season_data(year)
There we have it! We’ve come full circle, with all the data! You should now have numerous jsons file named after each game ids.
Example of the processed data
After scraping the API, we process all of the json files into a more manageable dataframe. More on this later!
Here is an example of a processed dataframe:
| game_id | season | date | home_team | away_team | game_time | period | period_time | team | shooter | goalie | is_goal | shot_type | x_coordinate | y_coordinate | is_empty_net | strength | is_playoff | home_goal | away_goal | home_offensive_side | shot_distance |
|---|---|---|---|---|---|---|---|---|---|---|---|---|---|---|---|---|---|---|---|---|---|
| 2019020910 | 20192020 | 2020-02-16 | Ottawa Senators | Dallas Stars | 3:03 | 1 | 03:03 | Dallas Stars | John Klingberg | Craig Anderson | True | Deflected | -39.0 | 30.0 | False | Even | False | 0 | 1 | 1.0 | 58.309519 |
| 2019020910 | 20192020 | 2020-02-16 | Ottawa Senators | Dallas Stars | 7:36 | 1 | 07:36 | Ottawa Senators | Jean-Gabriel Pageau | Anton Khudobin | True | Snap Shot | 75.0 | -2.0 | False | Power Play | False | 1 | 1 | 1.0 | 14.142136 |
| 2019020910 | 20192020 | 2020-02-16 | Ottawa Senators | Dallas Stars | 18:10 | 1 | 18:10 | Ottawa Senators | Brady Tkachuk | Anton Khudobin | True | Wrist Shot | 82.0 | 3.0 | False | Even | False | 2 | 1 | 1.0 | 7.615773 |
| 2019020910 | 20192020 | 2020-02-16 | Ottawa Senators | Dallas Stars | 18:43 | 1 | 18:43 | Dallas Stars | Stephen Johns | Craig Anderson | True | Slap Shot | -36.0 | 3.0 | False | Even | False | 2 | 2 | 1.0 | 53.084838 |
| 2019020910 | 20192020 | 2020-02-17 | Ottawa Senators | Dallas Stars | 49:59 | 3 | 09:59 | Ottawa Senators | Tyler Ennis | Anton Khudobin | True | Deflected | 83.0 | -7.0 | False | Even | False | 3 | 2 | 1.0 | 9.219544 |
| 2019020910 | 20192020 | 2020-02-17 | Ottawa Senators | Dallas Stars | 54:49 | 3 | 14:49 | Dallas Stars | Joe Pavelski | Craig Anderson | True | Snap Shot | -55.0 | 13.0 | False | Even | False | 3 | 3 | 1.0 | 36.400549 |
| 2019020910 | 20192020 | 2020-02-17 | Ottawa Senators | Dallas Stars | 63:48 | 4 | 03:48 | Ottawa Senators | Artem Anisimov | Anton Khudobin | True | Backhand | -77.0 | 1.0 | False | Even | False | 4 | 3 | -1.0 | 12.041595 |
| 2018020811 | 20182019 | 2019-02-06 | Florida Panthers | St. Louis Blues | 18:55 | 1 | 18:55 | Florida Panthers | Henrik Borgstrom | Jordan Binnington | True | Backhand | -81.0 | -3.0 | False | Power Play | False | 1 | 0 | -1.0 | 8.544004 |
| 2018020811 | 20182019 | 2019-02-06 | Florida Panthers | St. Louis Blues | 40:30 | 3 | 00:30 | Florida Panthers | Aleksander Barkov | Jordan Binnington | True | Snap Shot | -85.0 | -8.0 | False | Power Play | False | 2 | 0 | -1.0 | 8.944272 |
| 2018020811 | 20182019 | 2019-02-06 | Florida Panthers | St. Louis Blues | 43:05 | 3 | 03:05 | St. Louis Blues | Colton Parayko | James Reimer | True | Wrap-around | 94.0 | 6.0 | False | Even | False | 2 | 1 | -1.0 | 7.810250 |
Shot Types Exploration

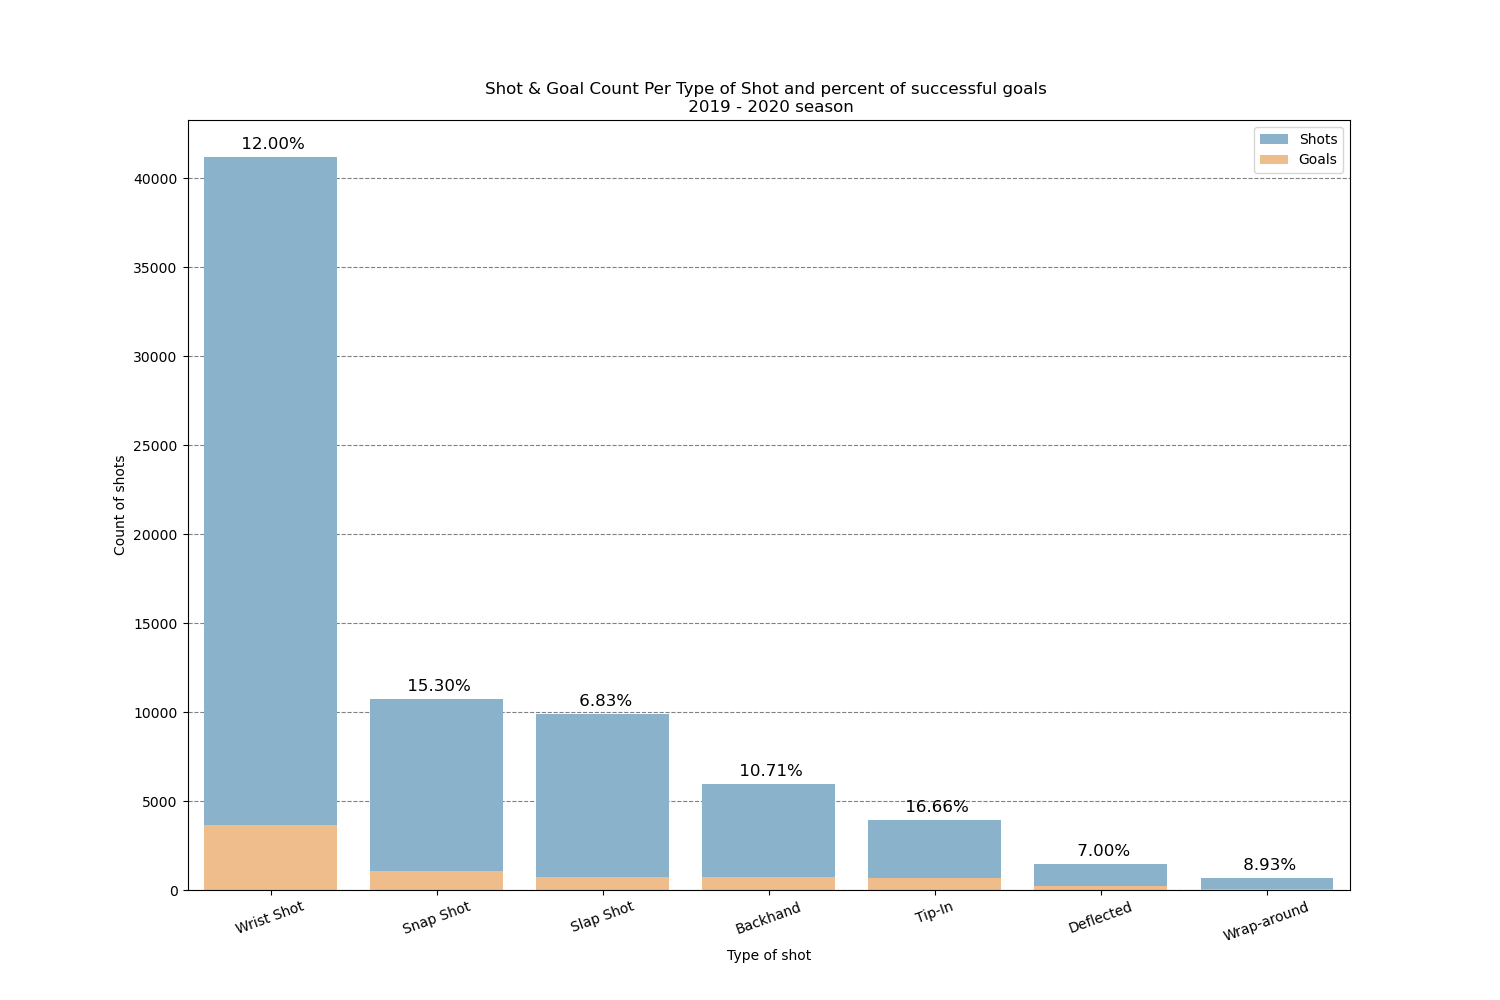
In this graph we can see that there are 4 main types of shots (Wrist shot, Snap shot, Slap shot and Backhand shot) taken from the season 2019-2020. Tip-in, deflected shots, wrap around tend to be more situational plays depending on the team’s position.
The most common type of shot is the Wrist shot with over a total of 40000 shots for the 2019-2020 season. This is not too surprising as it is the quickest shot to pull off and it can be effective from a wide variety of distance.
The most dangerous dangerous type of shot based on % of goal scored would be tip in at 16.66%, which represent situations where a player stand in front of the net to try and redirect a pass into the net. This is not too surprising as these type of plays challenge goalies to make quick save and gives them less time to prepare from the shot. We can also see that this is a play that is harder to pull off than just shooting the puck due to the low amount of shots made this way during a year. We could therefore expect a team that is more able to set up tip-in plays to be able to win more often.
Distance Exploration

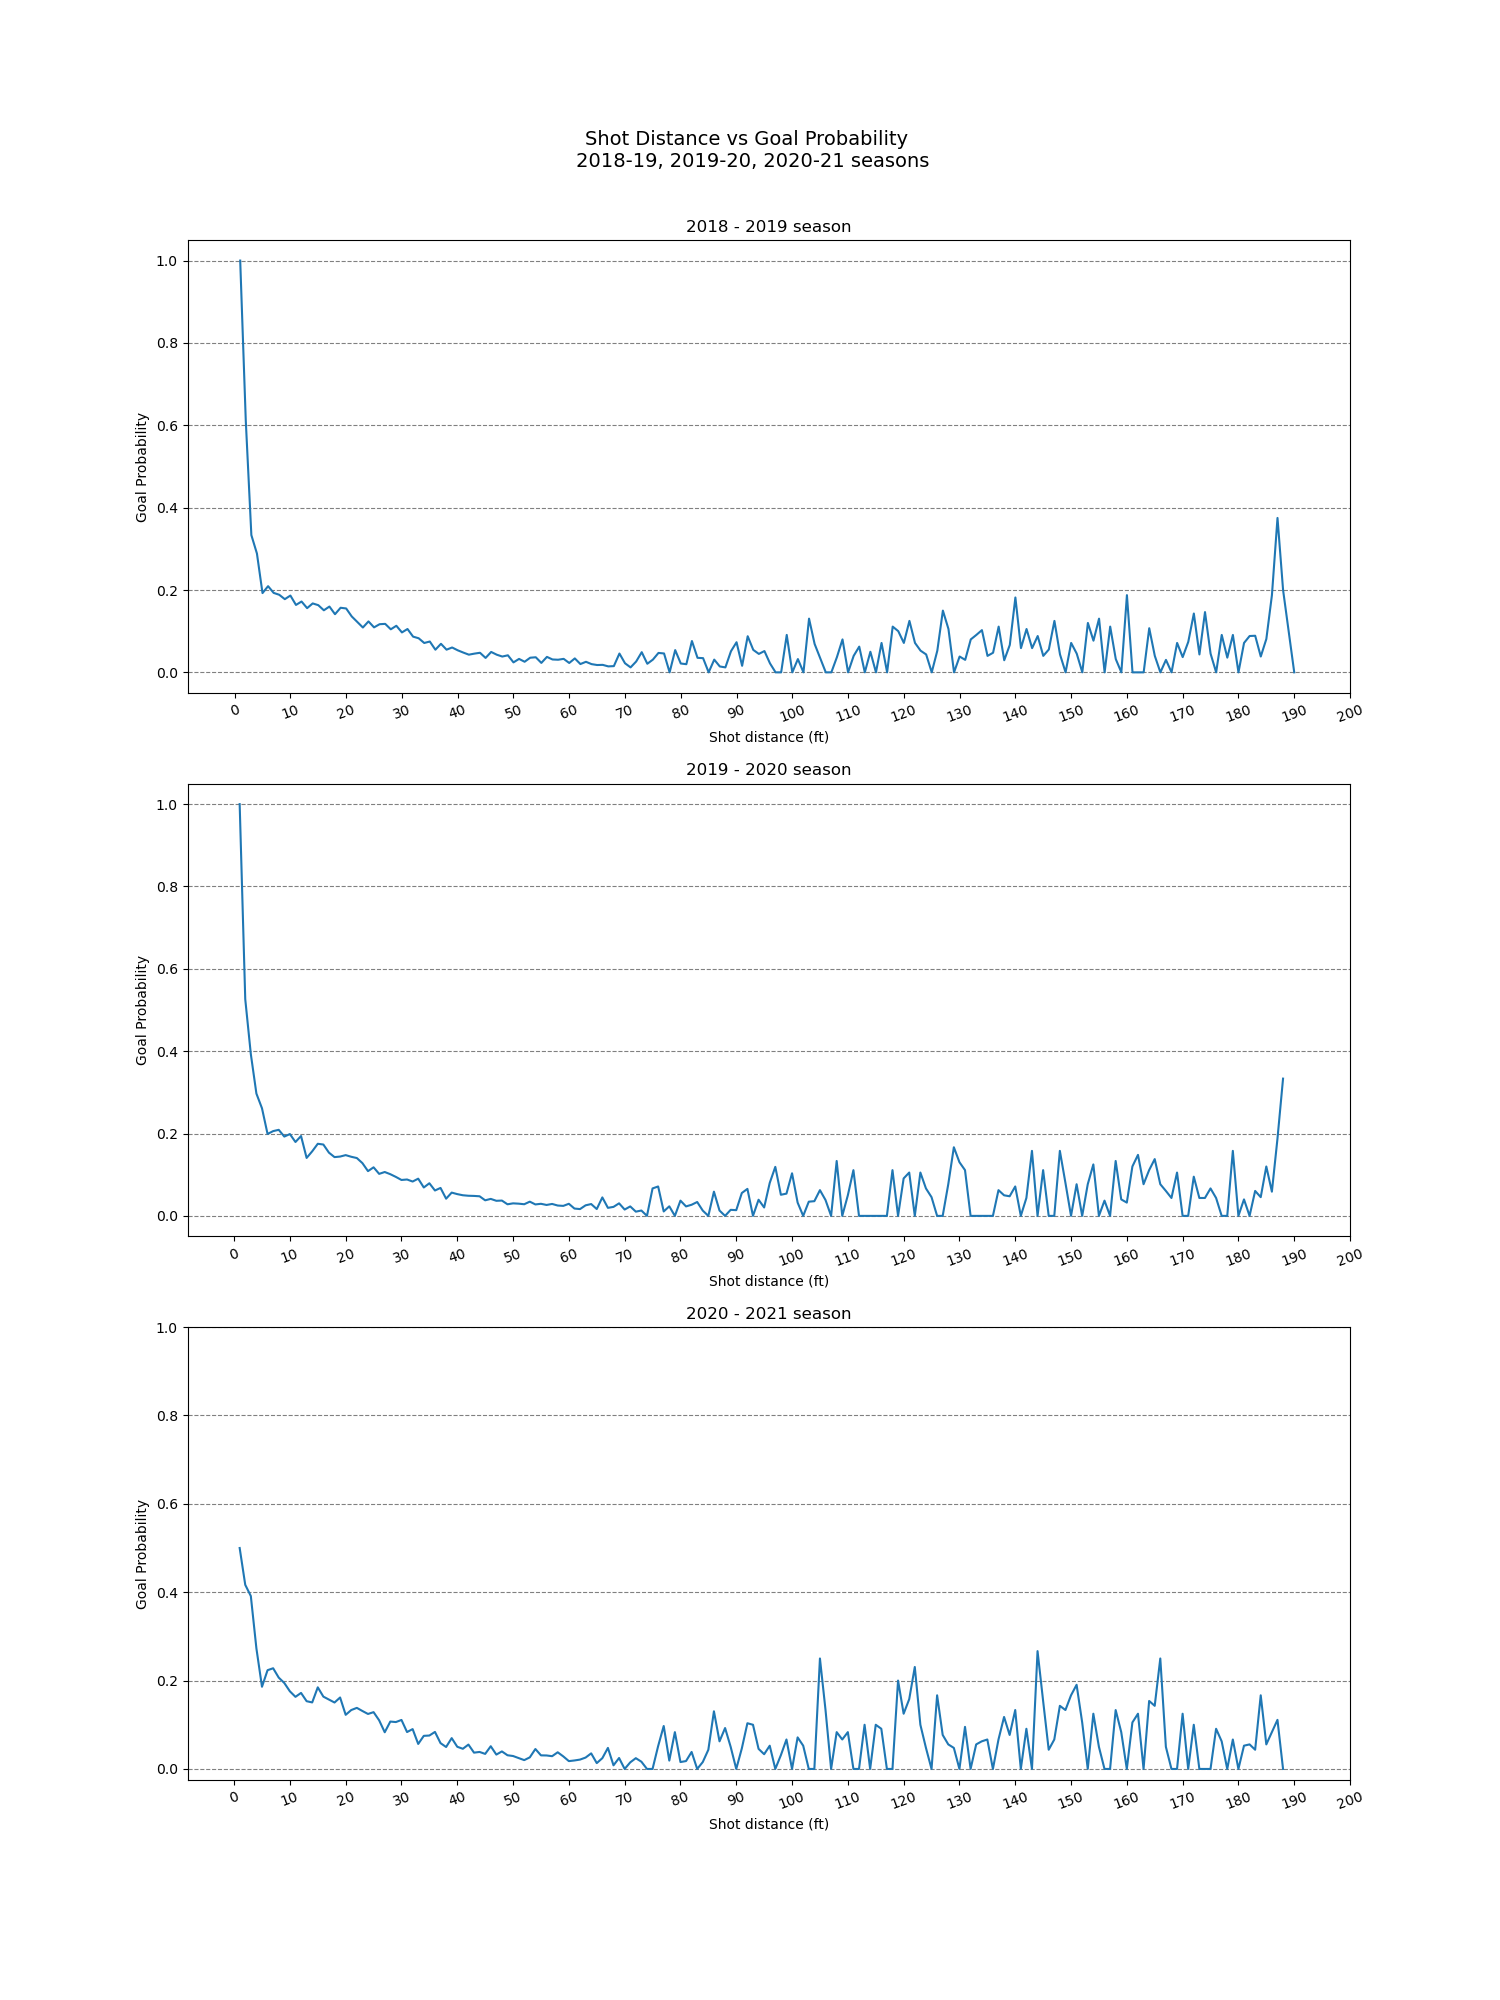
By analyzing the distance of a shot to the net and it’s probability of producing a goal, we can see that the probability is very high in a distance less than 10 ft from the net. This area provides clean shots on goal and is one of the most effective zones of snapping off a quick wrist shot.
We also see a lot of noise in the goal probability of shots coming from far away, this is mainly due to a low frequency of shots from that far and also from empty net goals which allows a team to aim the net from afar and shoot in it even from the defensive zone.
By comparing the 3 graphs and focusing our analysis on shots from less than 100 ft for the reason stated above, we can see that results by year are pretty stable. This is due to a consistent ruleset in the past couple years. If some rule changes happened giving goalers smaller equipment on widening the net we might’ve seen a distribution shift in our figures.
Goal percentage by distance from the net and the shot category

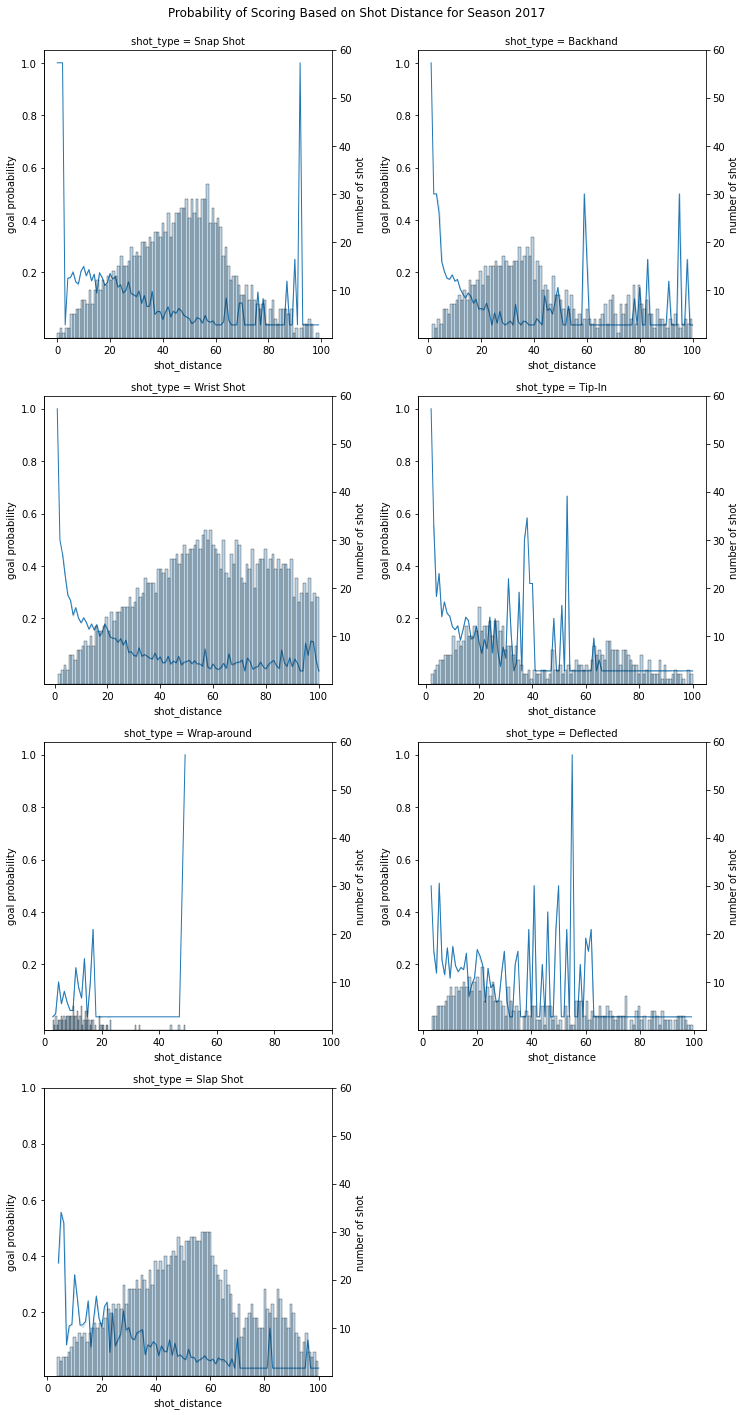
What we can see in this graphs, in all of the shot types, distance is inversely related to the probability of scoring.
We can also see that tip ins seem to be pretty effective when the distance to the net is less than 20 ft but their effectiveness dive down afterward. This can be explained by the fact that tip in shots are usually less strong as you don’t take a lot of time to transfer power to the shot so from two far away goalers have an easier time stopping those shots.
Looking at the 20-40 feet range, We can see that the most effective shots tend to be snap-shot and slap shots which allows player to make stronger shots that are able to surprise goalers.
From this analysis, our conclusion is that the best shot is dependent on your distance to the net and if we were a coaching team, these are the instruction we’d give to our player to try and maximise our scoring chance:
If you are less than 20 feet away from the net and want to take a shot, look around to see if a player is in position for a tip in, otherwise take a wrist shot on net.
If you are in the 20-40 feet range, try to surprise the goaler with a snap shot or a slap shot.
If you are further away from the net, look for a player in a better position than you.